Jean LeLoup & Bob Ponterio
SUNY Cortland
© 2017 |
Images do not always come exactly as you wish to use them. You
may need to do some cropping, adjust their colors or luminosity (brightness), change
their size (resolution), or modify their content (delete an ex-husband). For this lesson, you will download
the images on this page and follow the directions to change them using Photoshop
Elements (a good buy on an academic discount), Photoshop CE or any of the many image editing
tools available. You could also try GIMP, Paint.NET, Corel: PaintShop Photo Pro or other
image editors for PC or for the Mac . In fact, there are many programs available,
and one may even be included with the purchase of a digital
camera.
Our directions will apply to Photoshop Elements under Windows - for other
software you will have to make some minor adjustments, but the basic functions are
pretty much the same. You should always think more about what you are trying to accomplish than which button to press - in version 53 it may be a different button! 
We will be producing final images in JPG or PNG format as these
are best for compressed photos with many colors and smooth transitions. Photoshop's own format PSD is the best for working copies to avoid losing quality
over multiple saves, but PSD files are quite large and do not work on the web. JPGs compress very well, but the compression is "lossy" - some image quality is lost with each save - though quality settings control how much is lost and how large the file is; at the highest quality setting, very little is lost. You should not use compression until all of your editing is done and your final version of the photo is
ready. Then compress the final copy that will go online. It is also a good idea to always work on a copy so you can go back to your original backup copy if something goes terribly wrong.
n.b. Always use your image editor to adjust image size. Never adjust
image size of a large photo in your web page editor... well, almost never. Though it is possible to do this, it
is very inefficient and tends to result in poor image quality.
To begin, keep
this web page open, and open Photoshop (or whatever image editor you are
using) as well. You will be able to switch back and forth between
the Web browser and Photoshop to follow the directions while you complete
the tasks. If you prefer,
you can print out the directions and work from paper.
Cropping
First, decide where you will be working. Which folder on
your hard drive contains your image? For example, create a folder called "photos" or "Photoshop practice" or "tech course project 1" in
a place where you will be sure to find it, possibly in your My Documents or My Images folder or on your Desktop. Having a system for organizing your work will save time searching for things in the long run.
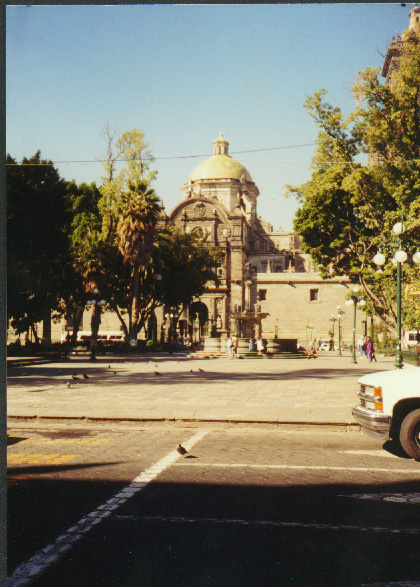
Download the photo of the church, "ph-church.jpg"
into your "photos" folder (right-click on the image and save the image, taking care to navigate to the correct folder). Next, open the image
in Photoshop or other image editor. Either look for your image from the Photoshop File/Open menu or drag your image onto the Photoshop icon or into the program window.
Remember that if you are using a different editing program, the commands to accomplish these edits will vary a bit. However, the basic ideas will be the same.
We want to crop the image to get rid of the car, the pigeon, and the
empty sky. Then we will make the final image smaller to fit our needs. |
 |
Once ph-church.jpg has been opened in your image editor, check to make sure that it is being
displayed at 100% of its full size so you know exactly what you are looking at (Photoshop will sometimes initially display images at smaller resolutions to make them fit on your screen). Look at the title bar  of the
ph-church.jpg window within Photoshop. It should say 100%
or 1:1. If not, you can use the Zoom tool
of the
ph-church.jpg window within Photoshop. It should say 100%
or 1:1. If not, you can use the Zoom tool  to change the way the image is displayed. Tools like the Zoom tool or the Marquee tool that we will soon be using, can be found in the Tools Window that is probably visible on your screen (if not, you can make it visible using the Window menu). When the zoom tool is selected,
clicking on the image will increase its apparent display size. Hold the Alt
key down and click to reduce the image display size (zooming in and out). This does not
really change the actual or real size of the image, just its appearance on the
screen. Don't confuse zooming with changing the actual image size. The key idea here is that unless you are at 100%, what you see is NOT what you get. Sometimes it is useful to zoom in or blow up an image while working on it, but always make sure you are aware of the zoom setting to avoid surprises.
to change the way the image is displayed. Tools like the Zoom tool or the Marquee tool that we will soon be using, can be found in the Tools Window that is probably visible on your screen (if not, you can make it visible using the Window menu). When the zoom tool is selected,
clicking on the image will increase its apparent display size. Hold the Alt
key down and click to reduce the image display size (zooming in and out). This does not
really change the actual or real size of the image, just its appearance on the
screen. Don't confuse zooming with changing the actual image size. The key idea here is that unless you are at 100%, what you see is NOT what you get. Sometimes it is useful to zoom in or blow up an image while working on it, but always make sure you are aware of the zoom setting to avoid surprises.
Next click on the Marquee tool button  to select a rectangular area of the image. There are lots of different selection tools, but Marquee is probably the one you will use most often. When an area of the image is
selected, effects (in other words anything you do) will apply only to that area. To select the area, look at the image and imagine
the rectangle within it that you wish to save as your final image. In this case, the top
should be a bit higher than the top of the church and the bottom should
be a bit higher than the hood of the car. The sides should come close
to the edges of the original photo. Point your cursor at one corner of your imagined rectangle. Next, click and hold with the marquee
tool on that corner, then drag the cursor to
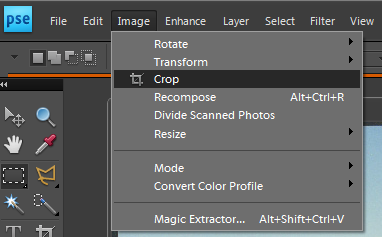
the opposite corner to select the area that you want. When you are satisfied with the selection, choose
the Image / Crop menu item to finish cropping the photo. to select a rectangular area of the image. There are lots of different selection tools, but Marquee is probably the one you will use most often. When an area of the image is
selected, effects (in other words anything you do) will apply only to that area. To select the area, look at the image and imagine
the rectangle within it that you wish to save as your final image. In this case, the top
should be a bit higher than the top of the church and the bottom should
be a bit higher than the hood of the car. The sides should come close
to the edges of the original photo. Point your cursor at one corner of your imagined rectangle. Next, click and hold with the marquee
tool on that corner, then drag the cursor to
the opposite corner to select the area that you want. When you are satisfied with the selection, choose
the Image / Crop menu item to finish cropping the photo. |
 |
Sometimes it is easier to see where you want the center of an image to be, rather than the corners. In Photoshop, hold down on the Alt key while you click and drag the Marquee tool from the center out to a corner instead of from corner to corner. If you need a square instead of a rectangle, you can hold down on Shift while dragging the marquee. Much
more can be done with the marquee tool (for instance circles), but that is enough for now. Note that if you are using other software, your mileage may vary.
Save your work, and remember to save it often. You may
wish to keep an archived copy of your original photograph in case you
some day need to go back to reprocess the image for some reason.
If you are not certain about where your image will be saved or which image
format will be used, select File / Save As... and check the location and also make sure that you have selected JPG when saving your final copy that is going online. (JPG tends to be good
for photographic images.) For serious work in Photoshop with no loss of image quality during complicated edits or to save photos with multiple layers or masks or other special Photoshop tools, you should use
Photoshop's native format (PSD) for your working copies (saving as JPG only as the last step). Another
option that can help avoid loss of quality may be to use JPG but at the highest quality setting for working
copies, then use more compression for your final version.
PNG has also become a popular image format for the web and can be used in place of JPG.
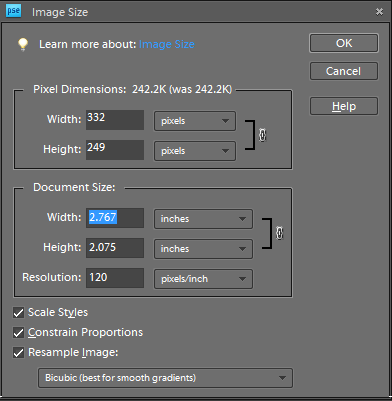
Finally, choose the menu item Image / Resize / Image Size... (Image / Image Size... in CE) to reduce the size of the image. Make sure that the constrain proportions box is checked so the proportions of the photo will be respected (This is the default setting). If you only change the width or the height, the photo will become distorted like the mirrors in a fun house. There are two ways to proceed. If the current resolution of the photo is 72, you can reduce the width and height by half (making the image 1/4 its current size or area) by changing the resolution to 36. You could also change either the width or the height by a percentage or by specifying the target size as a number of pixels. The other dimension will automatically change in the same proportion. Using pixels instead of percent can allow you to make all of a group of images the same exact height or width so they line up nicely on your web page or so that they present a consistent impression of size as an element of your web page style.
To alter the image size in this way in Photoshop Elements, you may need to check the resample image box if it is not already set. |
 |
To preserve
image quality, avoid making repeated changes. If you are not satisfied
with the results of the change and need to modify the image size more than
once, use the Edit / Undo menu item to restore the original image
before making the new change. Or you may use the History tab (or Undo History) to undo multiple edits. As a last resort, you can just close the image without saving and
start again. Something is lost in any manipulation, so make as few changes in as few steps as are necessary.
| Save your work and close the ph-church.jpg image,
but not the Photoshop program. When working on your own images, you might sometimes wish to save your work under a new name so you can always go
back to your original raw image in case you change your mind about what looks best. Also note that at some point in the future you might discover that you need a higher resolution version of your image for some other purpose, so it may be a good idea to save a high resolution backup copy for posterity while you can. |
 |
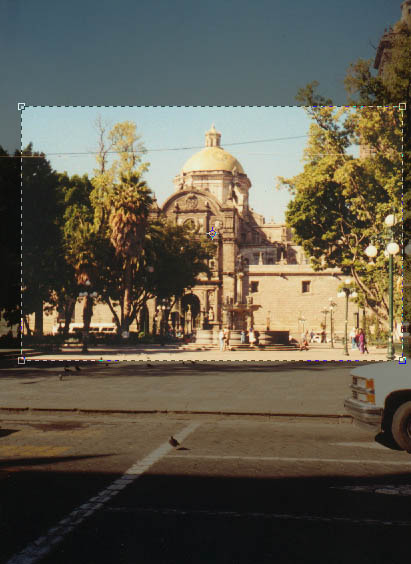
Using the crop tool to create a final image or print of a specific size

When you know in advance the exact dimensions needed for your end product (in a web page, PowerPoint, 4x6 prints, standard poster sizes, etc.), the crop tool  allows you to set the size of the selection and to keep the proportions of height to width constant. allows you to set the size of the selection and to keep the proportions of height to width constant.
For example, here we have selected an area with a width of 6 inches and a height of 4 inches. Dragging any corner will modify both the width and height of the selection proportionally. Then you can also modify the image size proportionally, keeping the same relative width & height as required for your final product. You can also drag the selection to a new spot in the image or even rotate the rectangle to create a slanted effect.
In this case, the 4x6 format might be used to create a set of postcards that students could use in a writing assignment. Of course, you could also use this technique to prepare your own digital photos for printing if you want to make sure that they will fit exactly on a 4x6 print without anything being cut off.
|
 |
Cutting out pieces
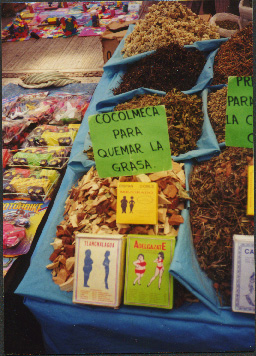
| Next we will open the ph-diet.jpg image to cut a
sign out for use in a new file. Download and open the photo. Because this
file will be very small and the boxes and signs contain few colors, we
will convert it to the GIF file format for our final copy. GIF is also the format to use for transparent backgrounds (when your background shows through part of your image), so it is useful to know something about it.
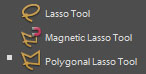
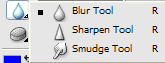
Click on the Lasso tool button
to select the outline of something in an image. Sometimes a tool may be hidden because there are multiple tools on a toolbar button, as in the picture above. We will begin with the
green sign that says "cocolmeca para quemar la grasa." When doing careful
work with small parts of images requiring good small muscle coordination,
it is far easier to first zoom in on the part of the image you are working
with. The more you zoom in, the easier it is to lasso just the piece that you want. You might try 400-500% zoom.
Point the lasso tool on one corner of the sign. Hold down on the
left mouse button while you drag along the sign around the other three corners.
When you have completed the circuit, release the mouse button. The
dotted path around the sign will be closed and the sign will be selected.
Using the lasso tool wasn't too easy, but it lets us select irregular outlines
that the marquee tool cannot capture. Also try the magic eraser tool. |
 |
| Because the edges of the sign are straight lines, there
is an easier way to do this. Point to the first corner again, but
this time hold the ALT key down at all times. Click on the
corner and release the mouse clicker (however, keep holding down the ALT key).
Click the mouse pointer on the next corner, forming a dotted line between
the first point and the next point along the edge of the sign. Click
on the next corner, still holding down the ALT key. You can continue
clicking around the edges until you get back to your first point.
When you release the ALT key, the sign will be selected. (You might also want to play with the Magnetic Lasso tool or the Polygon Lasso tool. Double-clicking ends the selection process for these.)
To make a new image containing just the sign, first copy the
selected image to the clipboard: choose the menu item Edit / Copy
or press Ctrl-c. Next create a new image window by choosing
the File / New... menu item. Select New Image from Clipboard. The new window will be just the size
of the selection in the clipboard. You might want to straighten the sign using various option in the Image/Rotate menu.
Try saving your new image as GIF file (for simple images with few colors, the GIF format sometimes makes smaller files than JPG). In some programs, you may first need to change the mode
from RGB Color (with millions of possible colors for each pixel) to Indexed Color (with no more than 256 possible colors for each pixel) using the Image / Mode menu
item. If your image has more than one layer, this will flatten
layers (as will the Layers / Flatten Layers menu), leaving everything in just one layer. Layers can be very useful (for instance to paste the sign into another picture), but layers are also
beyond the scope of this tutorial. In some programs that use layers, you
might need to flatten layers before changing the image mode. The default
options for an indexed color image (adaptive palette,
8 bits/
pixel,
diffusion dithering) are fine for now. Finally, choose
File / Save As..., change the file type to GIF, and rename
the file before you save it. Some programs might use a File / Export feature to do the same thing.
Remember GIF = few colors, cartoon-like; JPG = many colors, photograph-like. GIF can also produce transparent backgrounds or animated images, but that's for later. PNG format can also work on the web and is in some ways a cross between these two. |
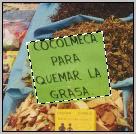 |
 gif gif

 png png
|
Adjusting exposure
| Sometimes an image may be too light or too dark for our
needs. Ideally a photo should make use of the entire range of luminosity
or brightness from black to white. This is also true in conventional photography. If an area of a photo is too light
or too dark, it means that part of the contrast range is squeezed into
too narrow a band. There are several ways to illustrate this and
to modify the way the image output will appear.
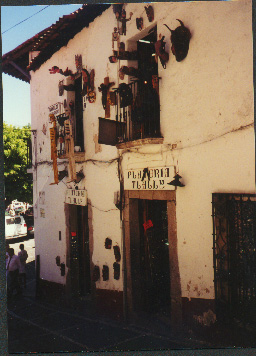
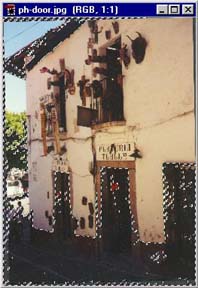
We will try to lighten the sidewalk in the ph-door.jpg image
at the right. First save a local copy and load it into Photoshop. |
 |
Choose the menu item Enhance / Adjust Lighting / Levels in Photoshop Elements (Image / Adjust / Levels... in Photoshop CE) to work with
the histogram for the image.

A histogram is a graphical representation
of the distribution of colors by order of brightness from black to white. The dark part of the image is mostly in the leftmost peak on the graph. The input levels are the values that will be displayed as black
(0 - the black triangle), white (255 - the white triangle), and the midpoint
between them (1.00 - the gray triangle). To change these values we
will slide the triangles by dragging them with the mouse.
|
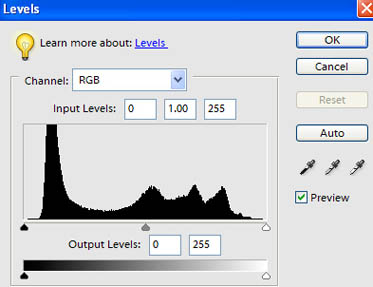 |
First grab the black triangle and slide it to the right, lining it
up with the beginning of the leftmost peak, changing the input level from
0 to 16. Notice that this makes the dark section look worse; we actually want to stretch out the colors in that range instead of compressing them, so move it back to the edge (back to 0).
Next, try moving the white triangle to the left just a bit to lighten up the highlights (moving it too far creates a washed out effect).
Finally, grab the gray triangle and slide it to the left until
the midpoint input level more evenly balances the light and dark areas. This effectively spreads
out the darkest colors, increasing the contrast in that region of the image.
The actual values used will depend on the adjustments needed to make any
particular image look best. Save the image with a new name (ph-door1.jpg).
Photoshop keeps getting better and better at performing automatic adjustments. Try out Auto Smart Fix in Photoshop Elements to see if that does a good job correcting problems in your image's lighting or color. Try out other automatic tools such as Auto Levels or Auto Red Eye Fix.
One problem we encounter when making these brightness adjustments is
that the changes affect the entire image, even if only a part of the photo
has a problem. This is even more true when using the simpler brightness and contrast adjustments. To avoid this problem, we will select
only the dark area of the photo in our next attempt to improve the brightness. Selecting the dark area using the marquee tool or the lasso tool would
be quite difficult because the area is not a simple shape.
We will make our selection using the Magic Wand  tool instead. Click on the magic wand and look for the Tolerance option at the top of the window. Set the tolerance to around 32 or 40. Why 32? Because the tolerance adjusts the sensitivity of
the selection, and I experimented to find a value that seems to work for me for this task tool instead. Click on the magic wand and look for the Tolerance option at the top of the window. Set the tolerance to around 32 or 40. Why 32? Because the tolerance adjusts the sensitivity of
the selection, and I experimented to find a value that seems to work for me for this task  This is something that you may have to experiment with for each different magic wand selection, depending on the area of the image that you are selecting. This is something that you may have to experiment with for each different magic wand selection, depending on the area of the image that you are selecting. |
|
| When you click the magic wand on the door or sidewalk, it will select
that point and all adjacent points that are within the tolerance limits.
That means that it will select an area of similar color and brightness. Your selection should look something like the picture at the right. Results are likely to be best if you can manage to select large uniform areas having similar exposures. It is also possible to modify the size of the selection using Alt to subtract an area from the selection or Shift to add an area to the selection.
Now you can use the menu item Enhance / Adjust Lighting / Levels or even Enhance / Auto Levels or Auto Smart Fix to make adjustments only to the selected
area.
Save your work under a new name.
Many other adjustments found under Image, Filter and Enhance can be quite useful. If your manipulations make an image begin to appear faded, you can enhance the Contrast. If the colors are washed out, you can enhance the Saturation. If the colors look odd, the Auto Color Correction function might help. Explore the adjustment options, and if you don't like your changes, use Undo. |
 |
Cloning
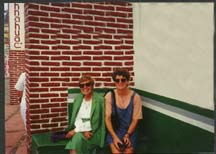
Sometimes there are things in a photo that you wish were not there.
The ads in the picture below attract attention away from the two women
who are the real subject.
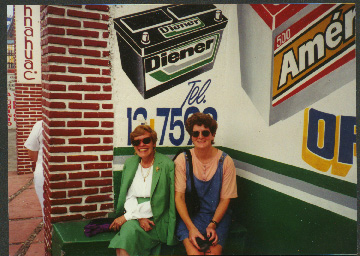
We can edit a photo in many ways. Simply erasing the ads would look odd because it leaves a solid, unnatural color. To make it look natural, we will
change the image by cloning from other parts of the photo using the
Clone
or Rubber Stamp  tool. Cloning in photographs is not illegal There are several steps
to using this tool. First decide what you want to remove or create and which
part of the image you can copy over the part you do not want. In
this case we will take the white part of the wall as our point of origin
to cover the ads.
tool. Cloning in photographs is not illegal There are several steps
to using this tool. First decide what you want to remove or create and which
part of the image you can copy over the part you do not want. In
this case we will take the white part of the wall as our point of origin
to cover the ads.
| First use the Zoom tool to zoom in on the area where you
will be working If it looks ok up close, it will look great when
you zoom out. Next select the Clone or Rubber Stamp tool. Point
to a white area that you want to clone, hold the ALT key and click once.
This sets the origin from which you will duplicate. Look at
the clone brushes, pick one that's not too big and not too little, preferably
a "fuzzy" brush where you wish to avoid sharp lines. Make sure that
the Rubber Stamp Opacity Options are set to 100% so the new image will completely
hide the old image.
Now slowly cover the ads with white from the wall. You will have
to reset the point of origin several times as you do this to cover a large
enough area. As you move your brush, the origin point moves as well. Avoid covering over anything that you don't have to.
The more original material you leave, the better the finished product will look. Think about shadows - is there really just one white? The
farther the point of origin is from the cloning area, the harder it will
be to see repeated patterns. (That's the psychology of perception.) If
you make mistakes, use the Edit / Undo menu item to undo them or use your History window.
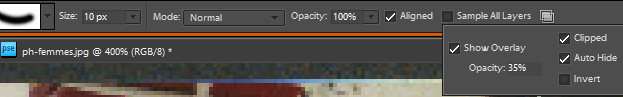
You might even get fancy and try to copy the brick wall, but watch out
for those lines and the perspective. To match up lines, you can use the preview feature. Click the double rectangle icon to check the Show Overlay box to preview the image to be cloned. You might also try the Clipped feature to see the preview only in the brush area or the Auto Hide feature for a cleaner view while you are cloning.
If you end up with any bad looking transitions between old and new material,
the smudge tool can help you smooth over the problem area.
Don't forget to save your work. |
 |
Putting it all together
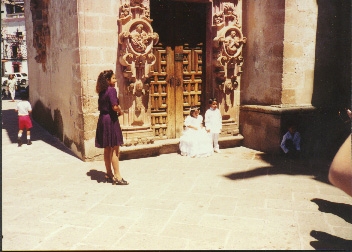
| Can you use all of the techniques to fix this image?
Crop it to get rid of the boy in the red pants on the left, the elbow
on the right, and some of the ground in front.
Put the woman wearing a purple dress in a new image by herself. - Select, copy, File/New, paste.
Use the rubber stamp to remove the little boy in the shadows to the
right, the woman in the purple dress, and the shadow on the ground in front
of the children.
Finally adjust the exposure as you see fit. |
 |
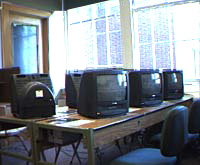
| Can you find a way to use the magic want tool to combine
the exterior from one photo with the interior from the other? You
may want to explore possibilities of the Select menu. |
 |
 |
The more you know about Photoshop, the more you can do. But it is a big and complex program, so don't try to learn too much too quickly. Play around with various tools. Use web searches to find tutorials about how other people have done what you are trying to do. Change colors, remove red-eye, get rid of that tourist who walked into your photo just as you snapped the picture. And practice, practice, practice.
For more information
Return to Syllabus